INTRODUCTION
Flood damage assessment is a crucial aspect of disaster recovery efforts, particularly in regions prone to flooding. With advancements in machine learning and computer vision, researchers are developing smart solutions to accurately assess flood damage using satellite images. The proposed architecture for damage assessment includes a module specifically dedicated to flood damage. This module utilizes satellite imagery to detect buildings before and after the flood, classify the damage to buildings post-flood, calculate the damaged area, and provide an EOS index to evaluate flood severity. By leveraging deep learning techniques, this module aims to provide timely and accurate assessments of flood damage, enabling authorities to respond effectively and allocate resources efficiently in flood-affected areas.
Background and Motivation
The use of satellite imagery for disaster damage assessment and response has grown in popularity. It is critical to prioritize rescue operations, disaster response, and relief activities following a disaster. These must be completed quickly and efficiently since resources are generally scarce in disaster-affected areas, and it is critical to identify the places that have sustained the most damage. However, the majority of current catastrophe mapping efforts are manual, which takes time and sometimes results in inaccurate data. Floods are among the most prevalent natural disasters that may harm people, infrastructure, and the environment. Floods are frequently seen in enormous amounts, and depending on the origin of the flood, they can inflict significant environmental and financial damage. Damage to a home or other types of structures is also common, and it may lead to a slew of issues in terms of restoration expenditures. It's crucial to have a flood damage monitoring system in place that can assess the extent of the damage caused by a flood.
Problem in Brief
Over the past few decades, natural disasters such as floods, wildfires have become more frequent than ever before. These disasters may cause severe damages not only to the properties but also be reasons for the loss of human and animal lives around the world. Furthermore, the effect of these disasters can be at individual levels or higher levels such as communities and have social, economic, and environmental consequences. In some cases, the damages can be irreversible. One of the most crucial and challenging tasks immediately following such a disaster is correctly estimating the tragedy's scope and severity. It will help to take necessary actions and thereby minimize the effects. This work is challenging in disaster-stricken areas. In these circumstances, remote sensing data is one of the best options for dealing with the problem. This study shows how to use remote sensing imagery from prior catastrophes to assess the damages caused by floods.
Aim and Objectives
Find the total number of buildings, damaged buildings in a certain area due to a flood event, and total flooded area to create an index to find the severity of the flood.
Proposed Solution
For multiresolution, multisensor, and multitemporal satellite images, it used a neural network architecture and demonstrated that it can perform building footprint and flooded building segmentation tasks. Then automatic calculation of flooded area is done and using those parameters an index is created to assess the damage. This method may be used to anticipate damage from a variety of flood occurrences. When compared to existing approaches, it significantly reduces time required to prepare flood maps for first responders.
Review and Related Work
Numerous experiments have shown that satellite images taken before, during, and after a flood, provided they are available, are useful in assessing flood damage in a variety of situations. The amount of the flood damage and the delineation of new flood limits may be determined using medium resolution data. In Indiana, Pantaleoni et al. (2007) employed Landsat data and change detection analysis to evaluate agricultural damage due to flooding [16]. For post-flood damage evaluation, Gianinetto et al. (2006) developed an integrated technique combining slope data from a Digital Elevation Model (DEM) with multitemporal Landsat images [13].
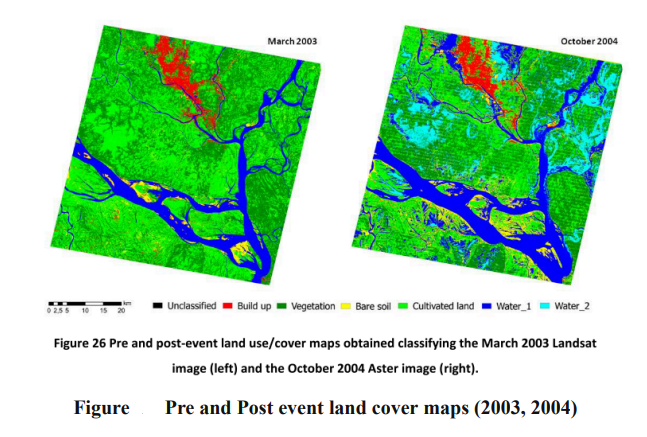
High-resolution data are ideal for determining damage sites and severity. They can also be utilized as blueprints for the reconstruction of bridges, highways, residences, and other structures. Scarsi et al. (2014) suggested an unsupervised approach of change detection methodology over extremely high-resolution photos for differentiating and measuring distinct types of change that happened following the 2013 catastrophic flood event in Colorado [14]. Chen et al. (2005) employed an automated change detection approach to estimate the damaged land use categories using an unsupervised classification on SPOT5 pictures taken before and after the 2004 tsunami [22]. To create the reference water bodies map, a pre-flood Landsat image was further categorized. The comparison of water classes allows for the identification and quantification of flooded regions. Furthermore, the flooded regions for each district in the research area were computed utilizing mathematical procedures in a GIS context, and the susceptibility of land use/cover type was emphasized.
The water classes in the maps resulting from the Landsat and Aster image classification were recovered and exported as vector layers.
● water class 2003 map - water bodies in their pre-event condition
● water class 2004 map - permanent water bodies and flooding, used to identify the floods. An overlay intersection approach was used to construct the vector layer of water shown in both maps, which shows permanent water bodies.
Approach
Special Thanks To : Kunal Jethuri
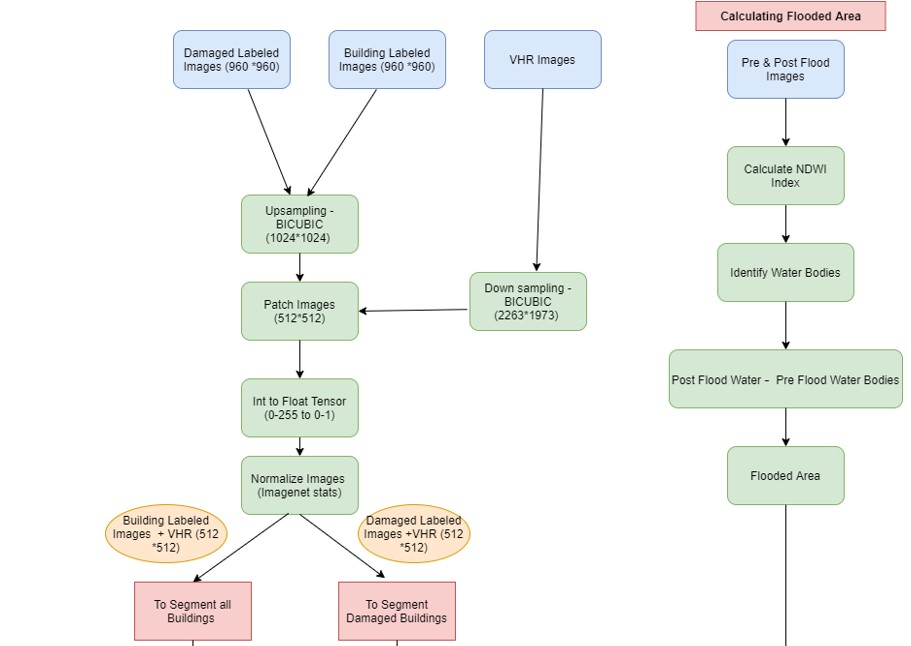
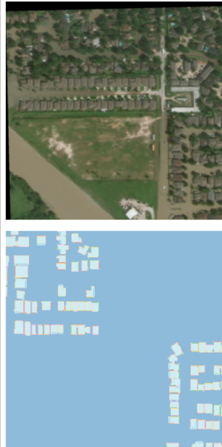
Free public images with a resolution of 0.5m per pixel were utilized from the Sentinel dataset of Very High Resolution Images (1973 * 2263 pixels). For both building and damage detection, masks (960 * 960 pixels) with a resolution of 1 meter per pixel were used. The area considered for the research is in Housten, Texas, USA and the flood event occurred in 2017 which was caused by hurricane Harvey.
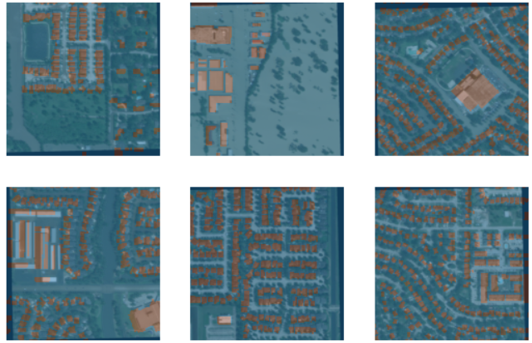
For the flood damage assessment as preprocessing steps, VHR Images were downscaled to (1024,1024) resolution using BICUBIC resampling technique. Bicubic resampling uses cubic splines to calculate new pixels. This approach works on the 4 by 4 cell of pixels surrounding each new pixel position during upsampling. For most images, this is the recommended resampling approach since it provides a good balance of accuracy and speed. Then the image masks were upsampled to (1024,1024) resolution using the same BICUBIC resampling technique. Then the images and their respective Masks were cut into 4 patches of resolution (512,512) each. After that, both VHR Images and Masks were converted from int tensor (0-255) to float tensor (0-1) and normalized using imagenet stats.
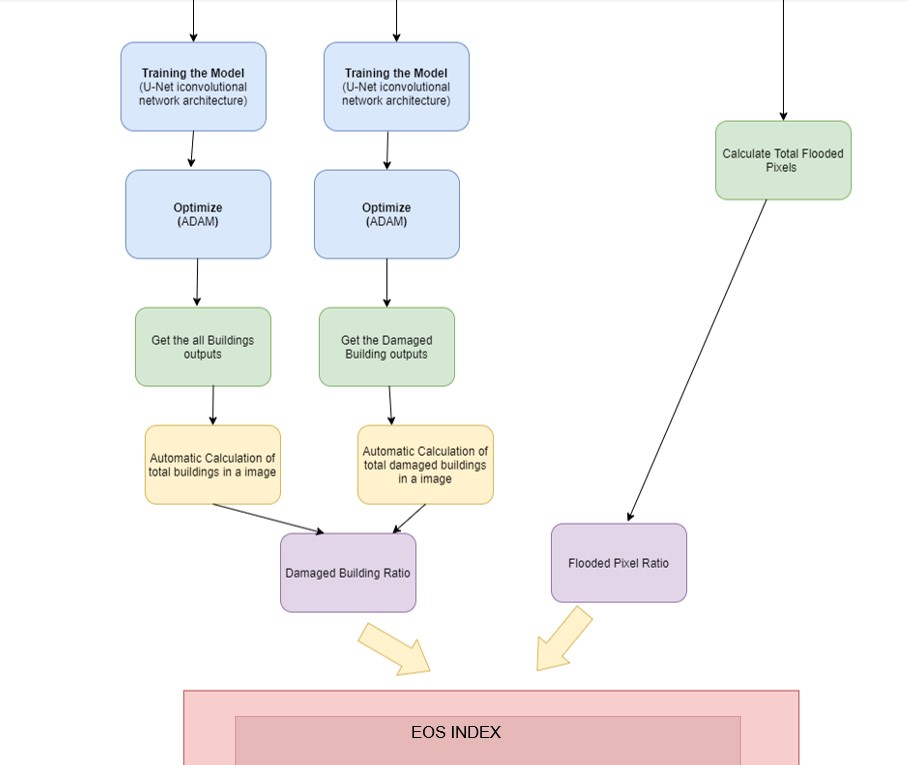
To train the model, U-Net is using Resnet-34 as a backbone. U-Net is a Convolutional Neural Network design for image segmentation that is quick and accurate. It's a network with encoders and decoders. The encoder component of the U-Net will be replaced by the resnet pretrained weights when using a U-Net with a pretrained resnet encoder. It's a transfer learning method, which means we don't have to train the model from the beginning.
Then to optimize the model ADAM optimizer is used. Adam is an optimizer that calculates adaptive learning rates for every parameter.Scheduler: One Cycle Policy is used for this model. The one cycle strategy consists of three steps. Using above techniques it is possible to identify the total number of buildings and damaged buildings by flood. Using those two parameters, Damaged Building Ratio is calculated by No. of Damaged Buildings/ Total No. of Buildings.
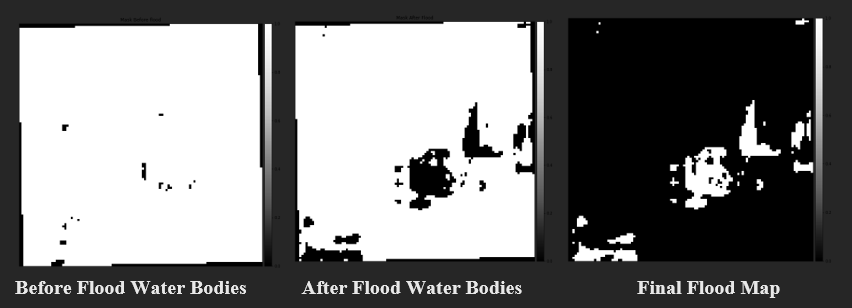
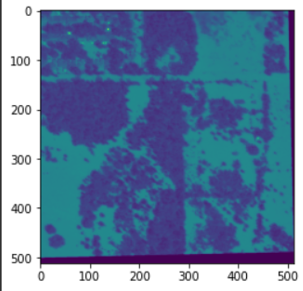
Next step is to identify the flooded area and calculate the area flooded by water. For that, first calculated the Normalized Difference Water Index (NDWI), which distinguishes the water body and dry land from satellite images, using the Green Band (B3) and Near Infrared (NIR) Band (B8) of the data, before and after flood satellite images obtained using Sentinel-2. Then, utilizing the NDWI of pre-flood and post-flood, created ground truth for the satellite photos. This is obtained by taking the difference of water bodies in the image before and after flood. Finally a flood map is created and then by using a pixel based approach, flooded pixels are calculated and also the total number of pixels in the image is calculated by multiplying the height and width of the image. By using those two parameters, flooded pixel ratio is calculated by flooded pixels/ Total pixels.
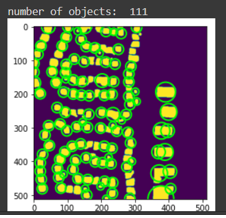
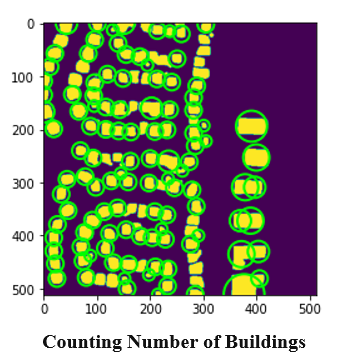
Here I have used counting the number of buildings on a satellite image using object detection algorithms. By detecting the edges of an image, the program can recognize the building and count the number of buildings in the image. Here it calculates the image density, whose integral over each image region tells the number of objects in that area. Because automated counting is objective, dependable, and repeatable, automatic systems are far more accurate than human counting when comparing the number of buildings. When a human counts manually, each measurement usually yields a different result, whereas automatic algorithms consistently produce a unique value. The application can recognize and count the total number of objects in the image automatically. One of the major challenges in the field of image processing is detecting a target item that is uncertain due to the presence of other objects. The canny edge detection algorithm detects the edges of the building by passing the high pass filtered image through it. It has a lot of sub functions, such as double thresholding, image differentiation based on intensity variations, and preventing false edges. At this stage, the secondary edges in the image are retrieved by removing connected components and performing edge detection.
Analysis and Design
Flood Damage Assessment
IMPLEMENTATION
For multiresolution, multi-sensor, and multitemporal satellite images, we used an end-to-end trainable neural network architecture and demonstrated that it can perform building footprint and flooded building segmentation tasks, as well as demonstrating that publicly available imagery alone can be used for effective flooded building segmentation.
Segmentation summary
Loading plotted image
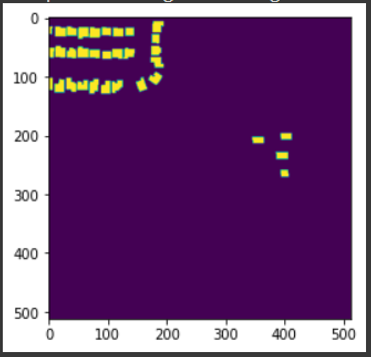
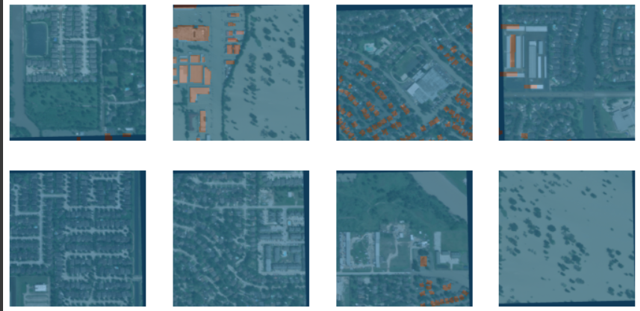
Building with masks
Prediction
Prediction
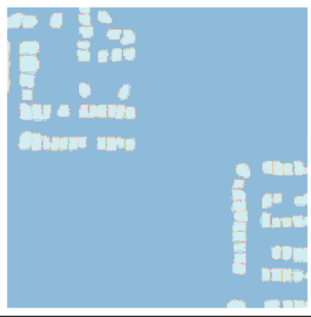
Images with masks
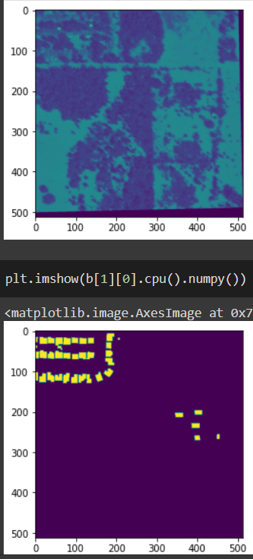
Images with masks
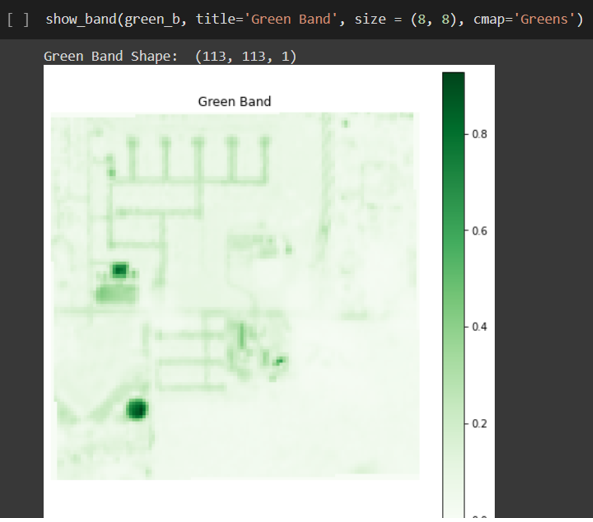
Green Band Visualization
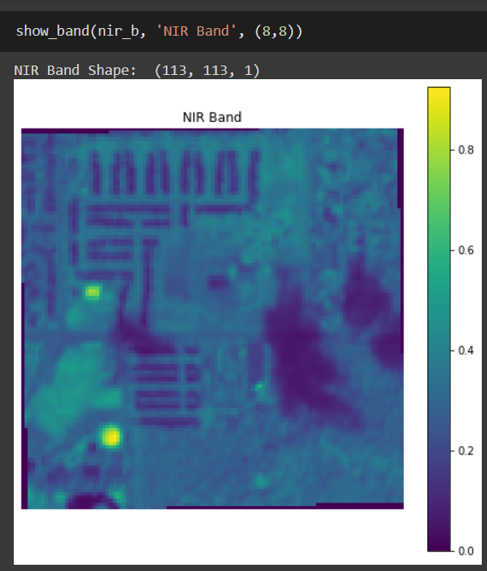
Near Infrared Visualization
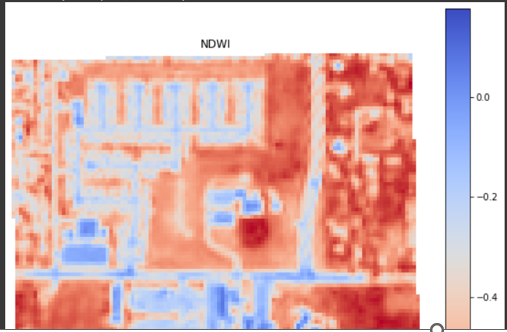
NDWI Band Visualization
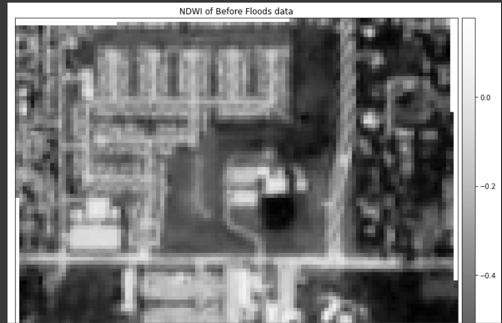
NDWI Before Flood
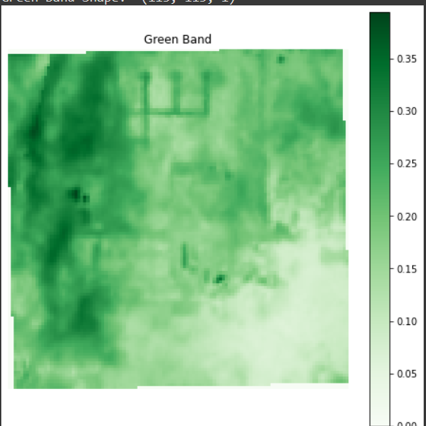
Green Band
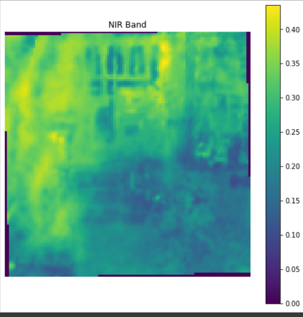
NIR Band Visualization
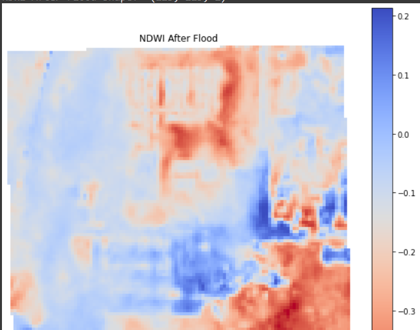
NDWI After Flood
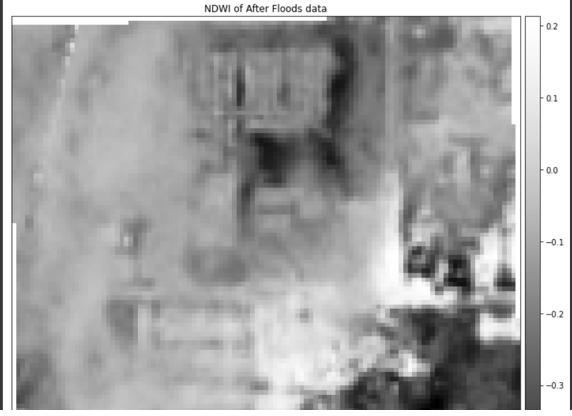
NDWI After Flood
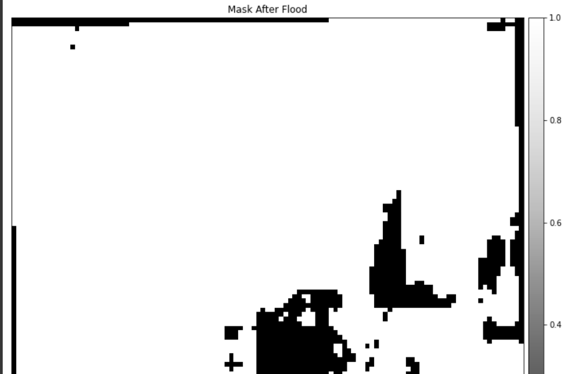
Mask After Flood Visualization
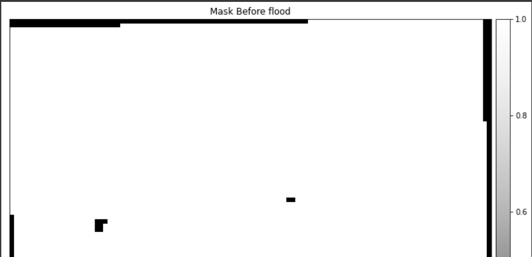
Mask Before Flood Visualization
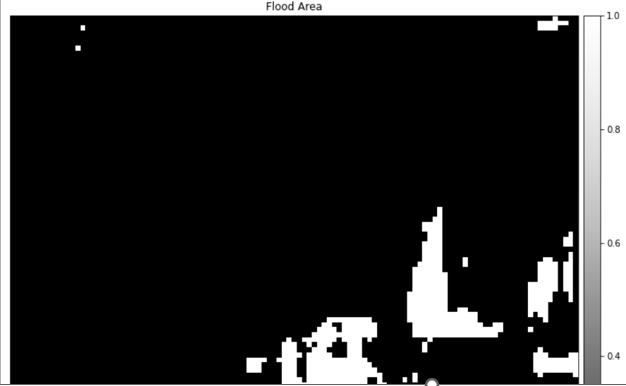
Flood Map